Wood Buffalo Environmental Association
Infographics, Poster Design, Direct Mailer, Web Graphics
Project Introduction
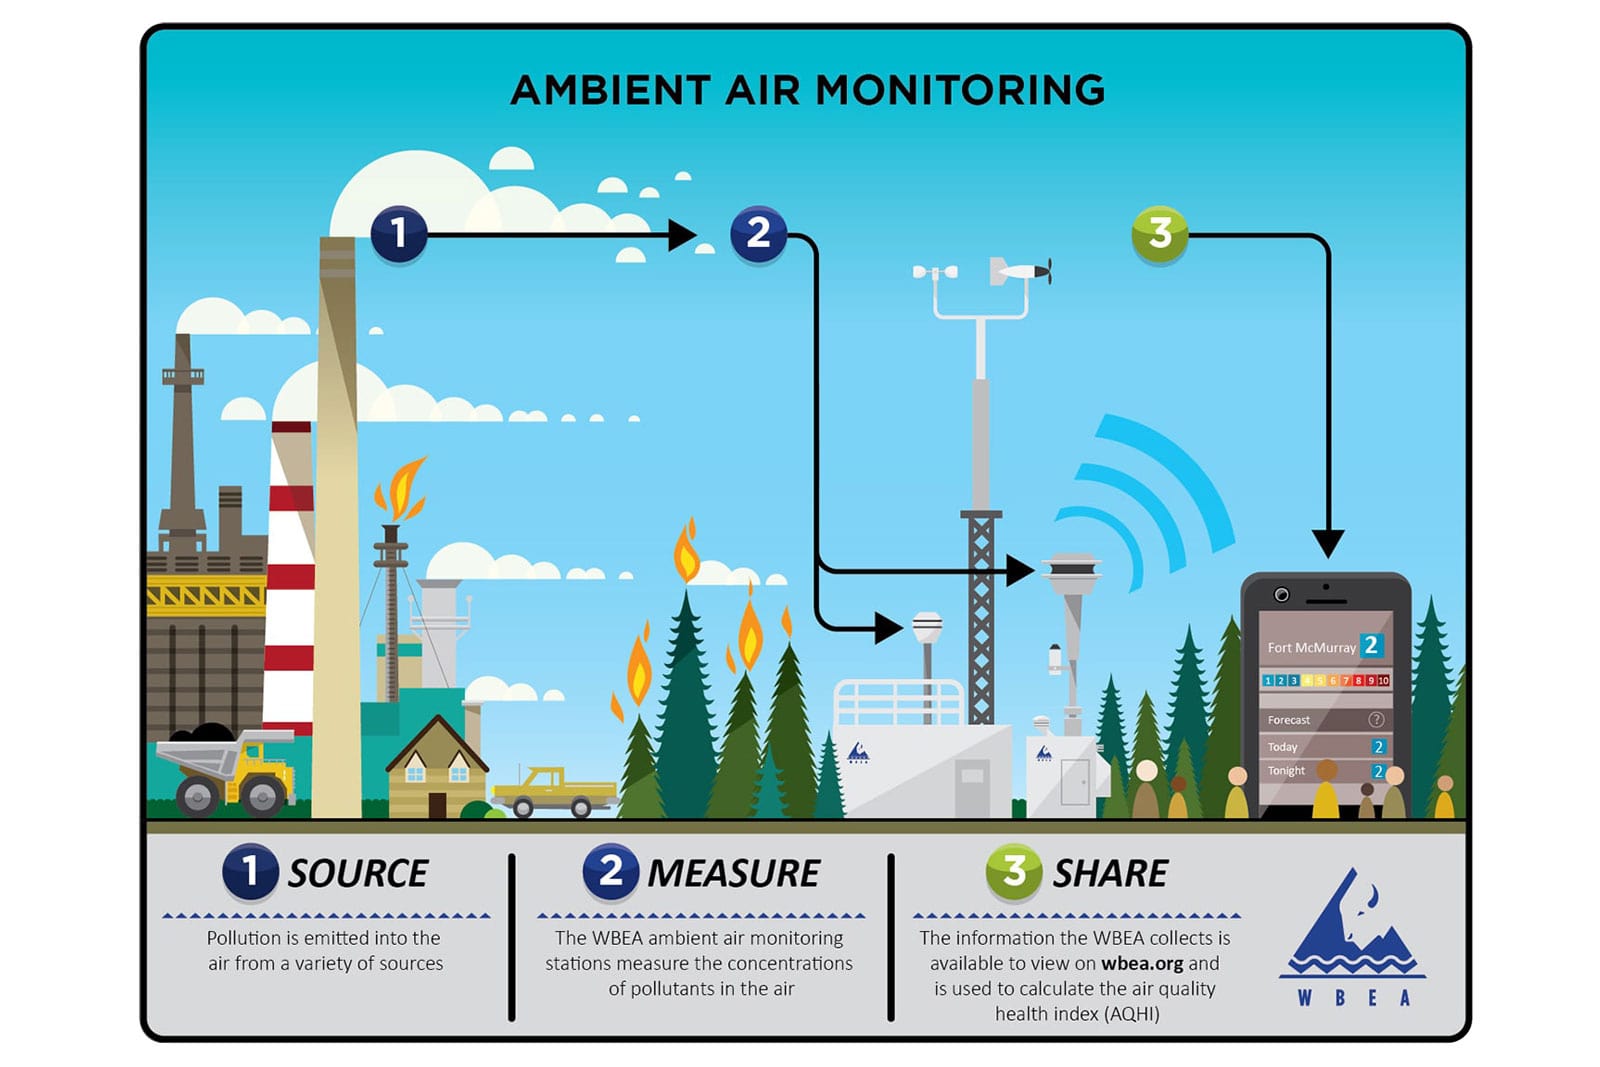
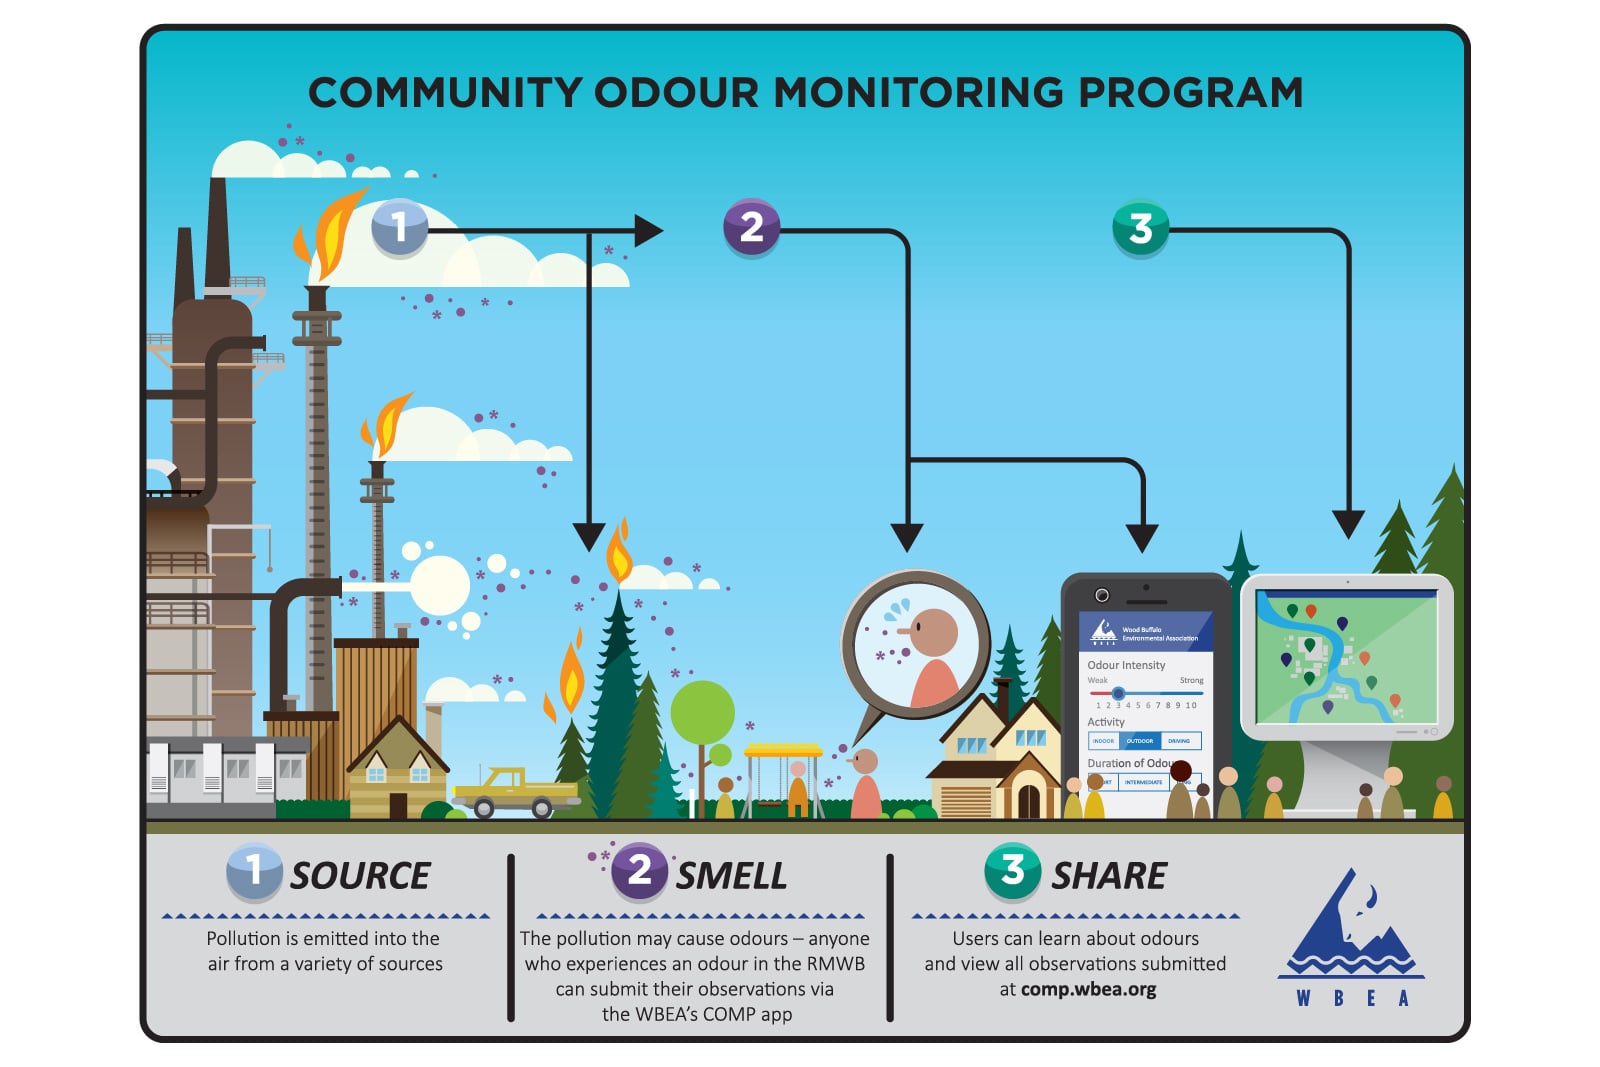
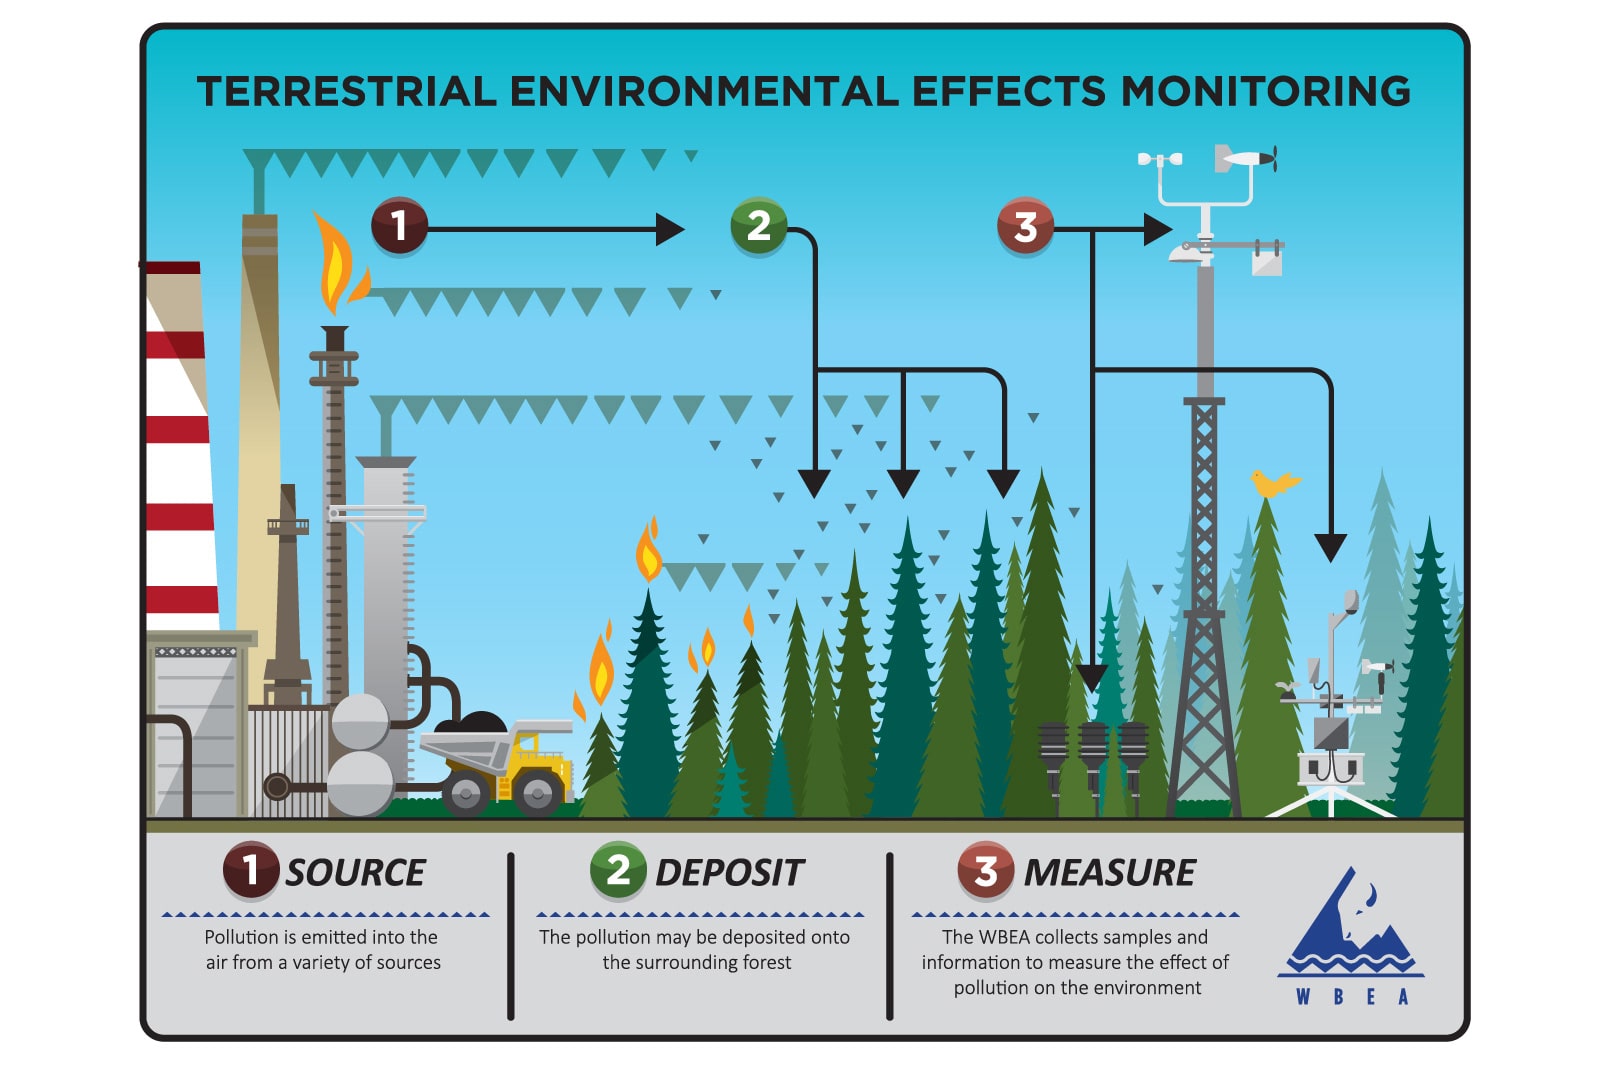
Wood Buffalo Environmental Association approached us to create a set of infographics that will communicate what the WBEA do and how it helps the general public. We researched and distilled a lot of data and visuals and decided on this landscape “side-scroller” solution. Here, the pollution is emitted on the left side - travels across the illustration and we are shown how data is collected and then shared.
Specific Details
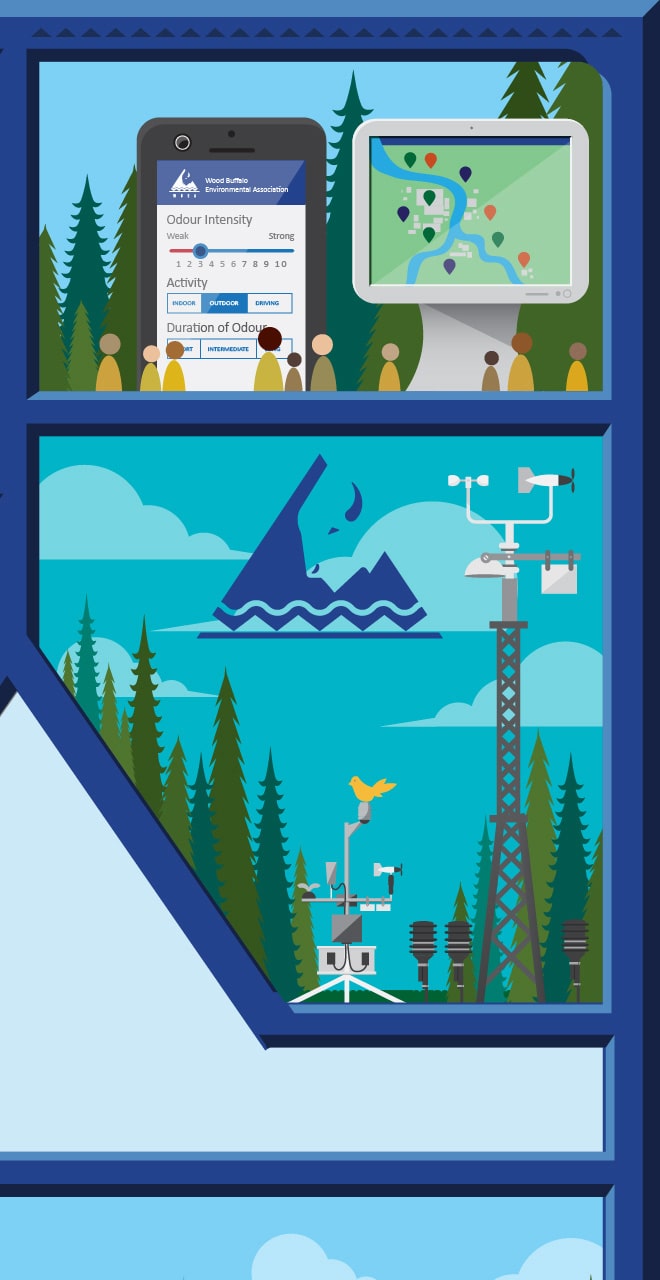
We created 4 illustrated infographic solutions to represent: Ambient Air Monitoring, Community Odour Monitoring, Terrestrial Environmental Effects and a promotional Illustration for the WBEA itself. All the infographics were converted in direct mailers, web graphics or posters.
Interesting Facts
The WBEA has some pretty interesting gear to get all this data. A lot of the items I was illustrating looked like they could have come from NASA!


